The world happiness report is an annual report on the world’s wellbeing and how to improve it. With data from over 140 countries. This report aims to further analyse the data from 2019 to 2025.
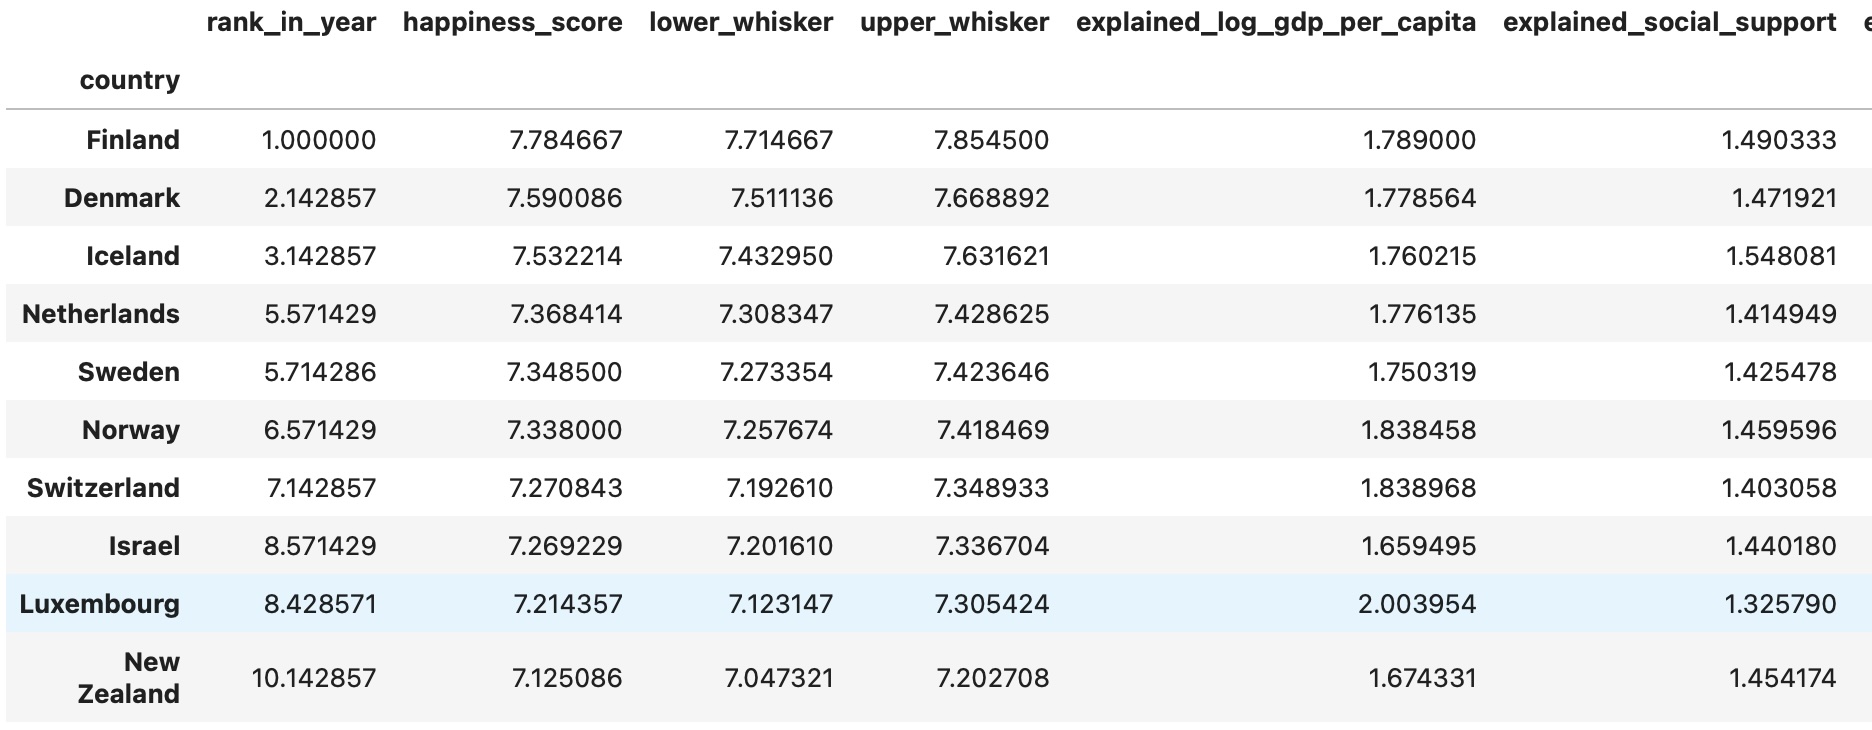
When averaging out across the 6 years, Finland was always number 1 when ranked by happiness score with an average of 7.78 (3 s.f.). 4 of the top 10 countries were also Scandinavian (Denmark, Iceland, Sweden & Norway respectively). Along with 3 rich European nations (Netherlands, Switzerland & Luxembourg) and surprisingly, rounding out the top 10 is Israel and New Zealand.
At a glance, these countries likely place so highly because of the countries overall wealth and gdp (will be shown below). With the explained log of gdp per capita being the highest for Luxembourg meaning that large parts of its happiness could be explained by its gdp per capita.
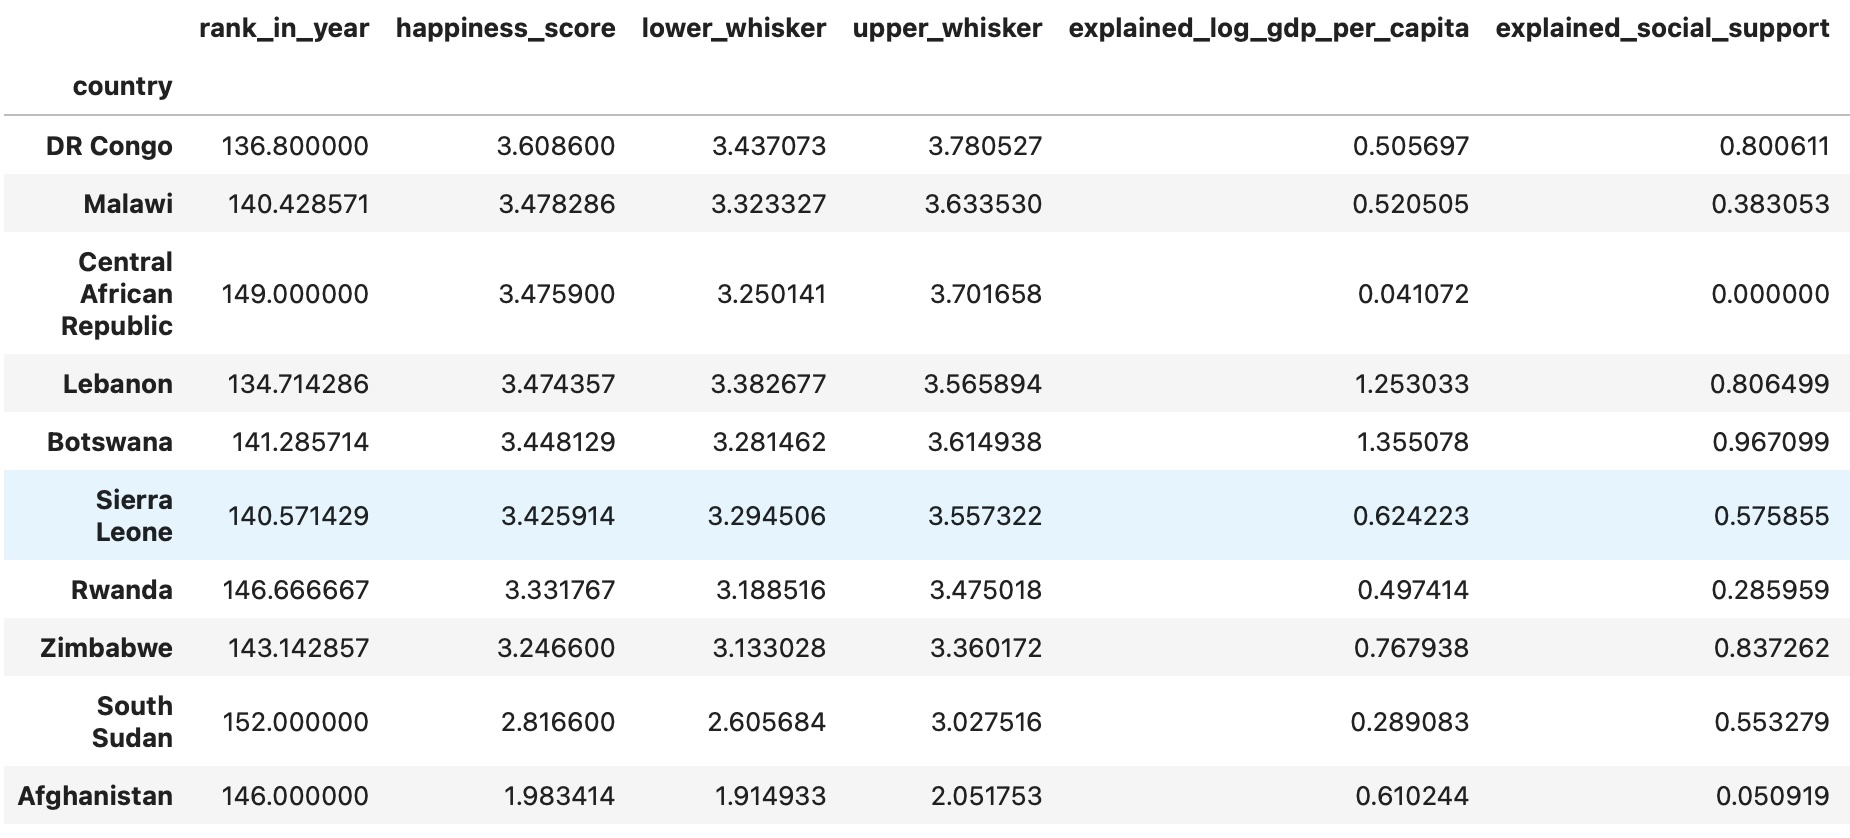
As for the 10 countries with the lowest happiness score, 9 of them were African nations. However, the country with the lowest happiness score is not an African nation as it was Afghanistan. These scores are likely explained by factors not included as well as both explained by social support and explained by log gdp per capita as the regression values are similar. Additionally, other potential factors such as political unrest and lack of safety could be a reason for the lower happiness score.
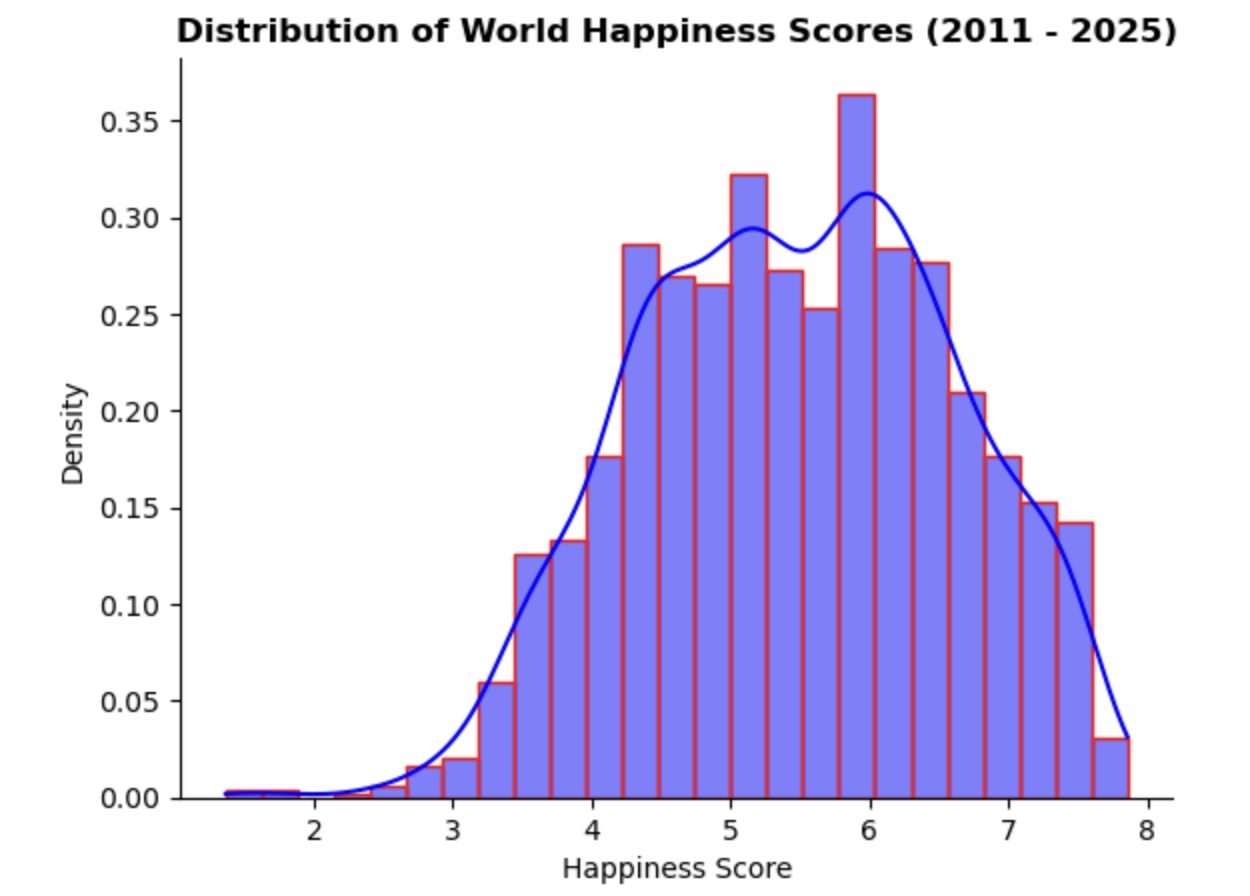
To illustrate the happiness scores globally, a distribution of happiness scores is graphed. This histogram has a slight bell curve, which could mean that across the 140+ countries measured, the happiness scores follow a slight normal distribution. With the highest density of happiness score falling between 5.75 - 6 and the smallest density falling below a score of 3.
Overall, this seems to pain the picture that the world is moving towards a higher happiness score with 5.47 (3.s.f) being the mean value of happiness across all countries across the 6 years.
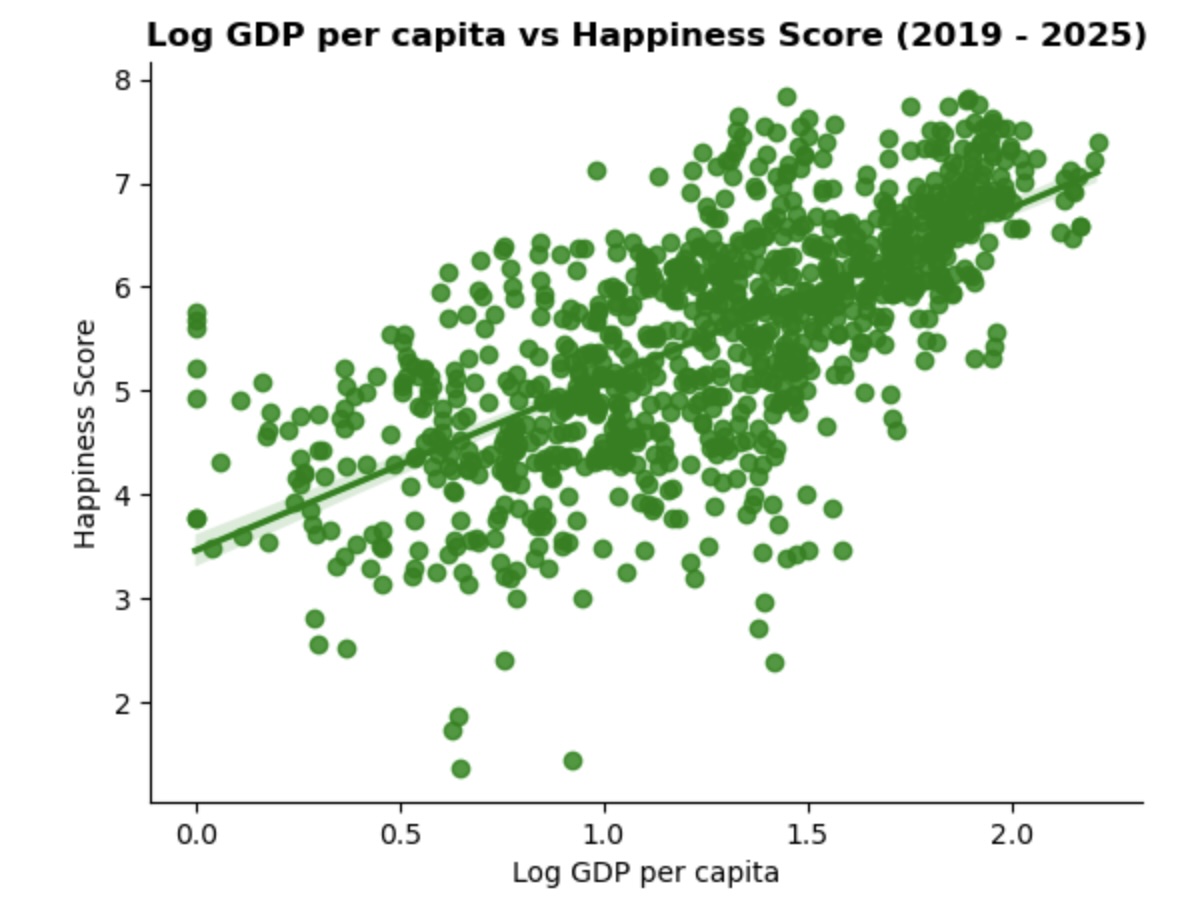
Combining happiness scores with GDP per capita, scatter plots were graphed in order to understand the relation between happiness score and the variables annual report. First was log gdp per capita. Although, there is quite a large dispersion, the trendline shows a positive linear relation between these 2 variables. With lower gdp per capita values, there is a larger dispersion. Whereas, towards the higher gdp per capita countries, there is less dispersion in happiness scores.
For countries with low happiness scores, a way to improve happiness would be policies dedicated to increasing the country's gdp, especially gdp per capita and attempting to keep inequality low, so the gdp is evenly distributed.
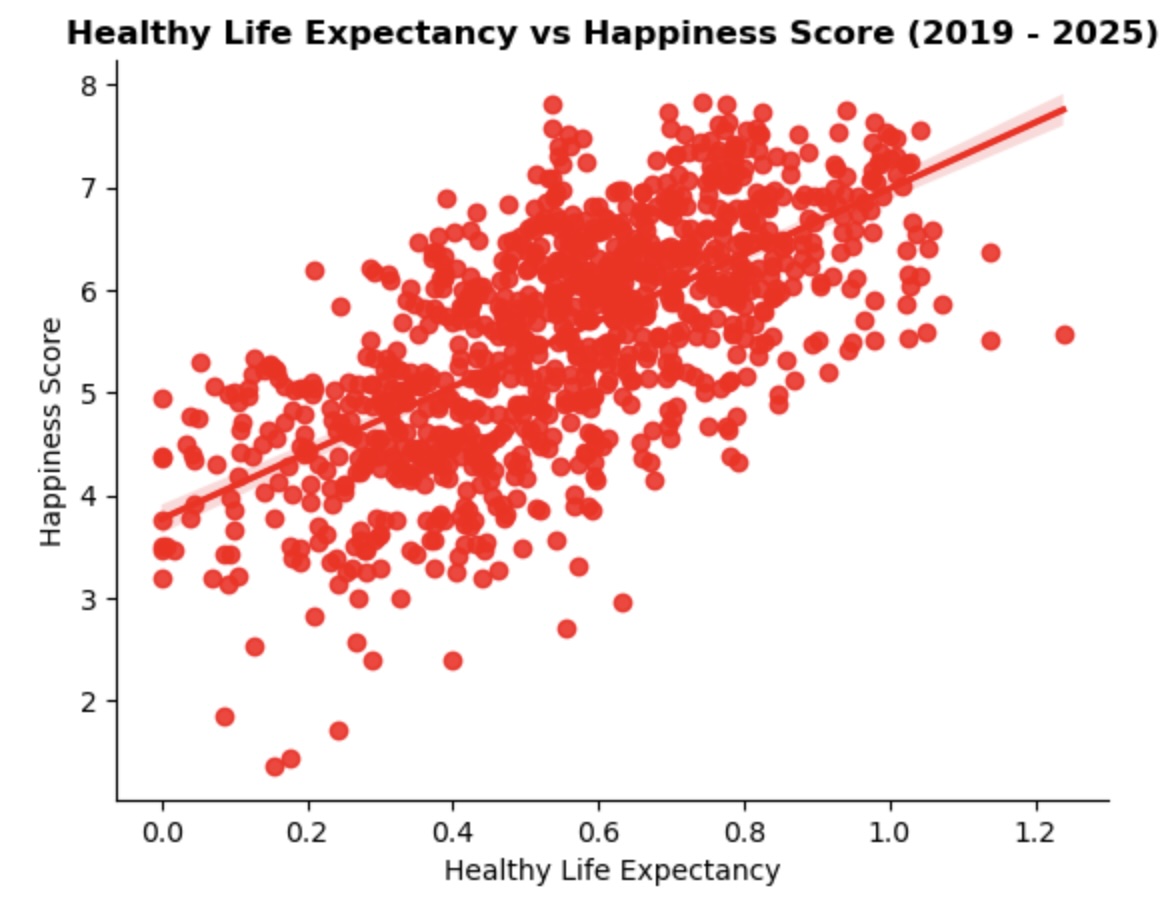
Similar to log GDP per capita, healthy life expectancy has a positive relationship with happiness scores. This is likely to be a strong contributor to happiness scores as more developed nations do not have to worry as much about safety and illness, hence leading to longer lives. In addition, without these worries, they are likely able to live happier.
As the countries with the lowest happiness scores tended to be less developed. Governments could introduce policies to make healthcare more accessible through subsidising essential medicine or schemes to train more healthcare professionals along with slowly building more hospitals.
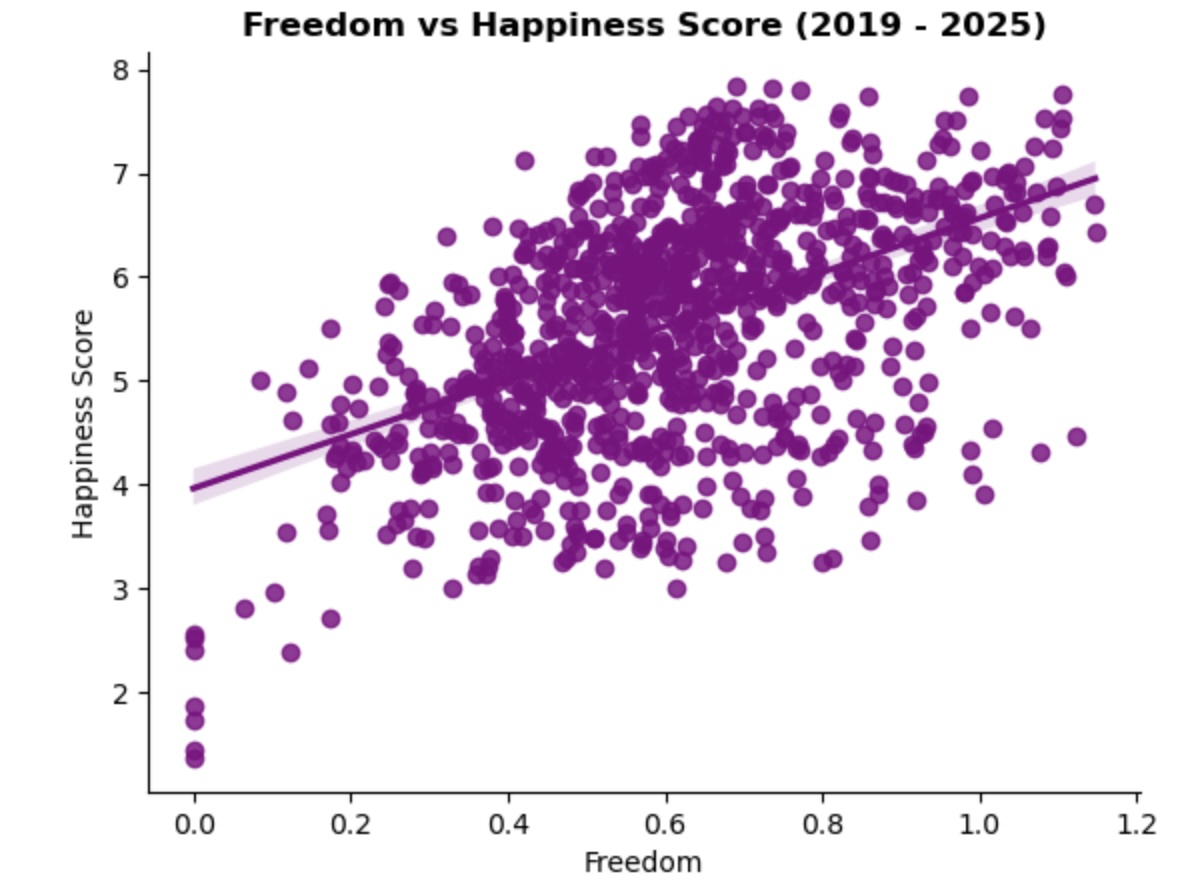
Furthermore, as expected, there is another positive relationship between freedom and happiness scores. With higher levels of freedom, people tend to be happier as everyone is able to do what they want to. However, most of the values fall near 0.6 units of freedom, at around this point, countries with similar levels of freedom have a wide range of happiness, so obviously freedom is not the largest proponent of happiness. As Finland’s explained freedom value was 0.858 which was lower than its explained log gdp per capita and explained social support but higher than its explained healthy life expectancy and corruption.
Although freedom is difficult to measure, it seems most countries give its citizens freedom to choose what they want to do in their lives and how they act. Even though not calculated, countries with less liberal policies could experiment in creating more freer laws which could further increase their happiness scores.
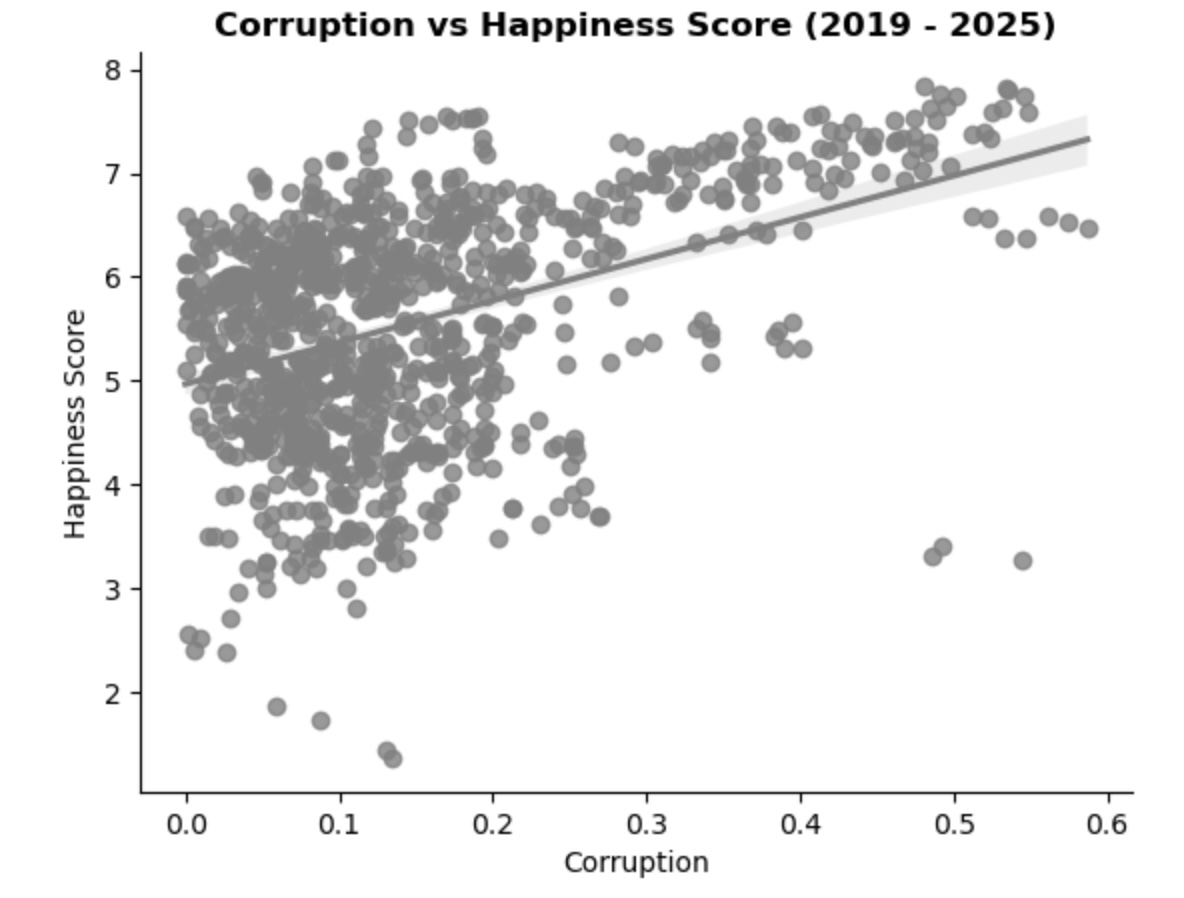
There is a surprising association between corruption and happiness scores, with a slight positive one. This is surprising as more corruption within a country's government, you would typically associate as negative and this could affect a person's happiness negatively. As happiness is generally high despite all levels of corruption. This shows that people either do not see the corruption or that people's happiness is not affected by a government's corruption. With Finland's explained by corruption value being 0.515 (3.s.f), higher than the other 10 happiest countries.
Despite, corruption being a small factor in happiness scores, countries looking to increase happiness marginally may seek to reduce corruption. With Finland having the highest value explained by corruption amongst the top 10 happiest countries, and Finland being the 2nd least corrupt country according to Transparency International(2025).
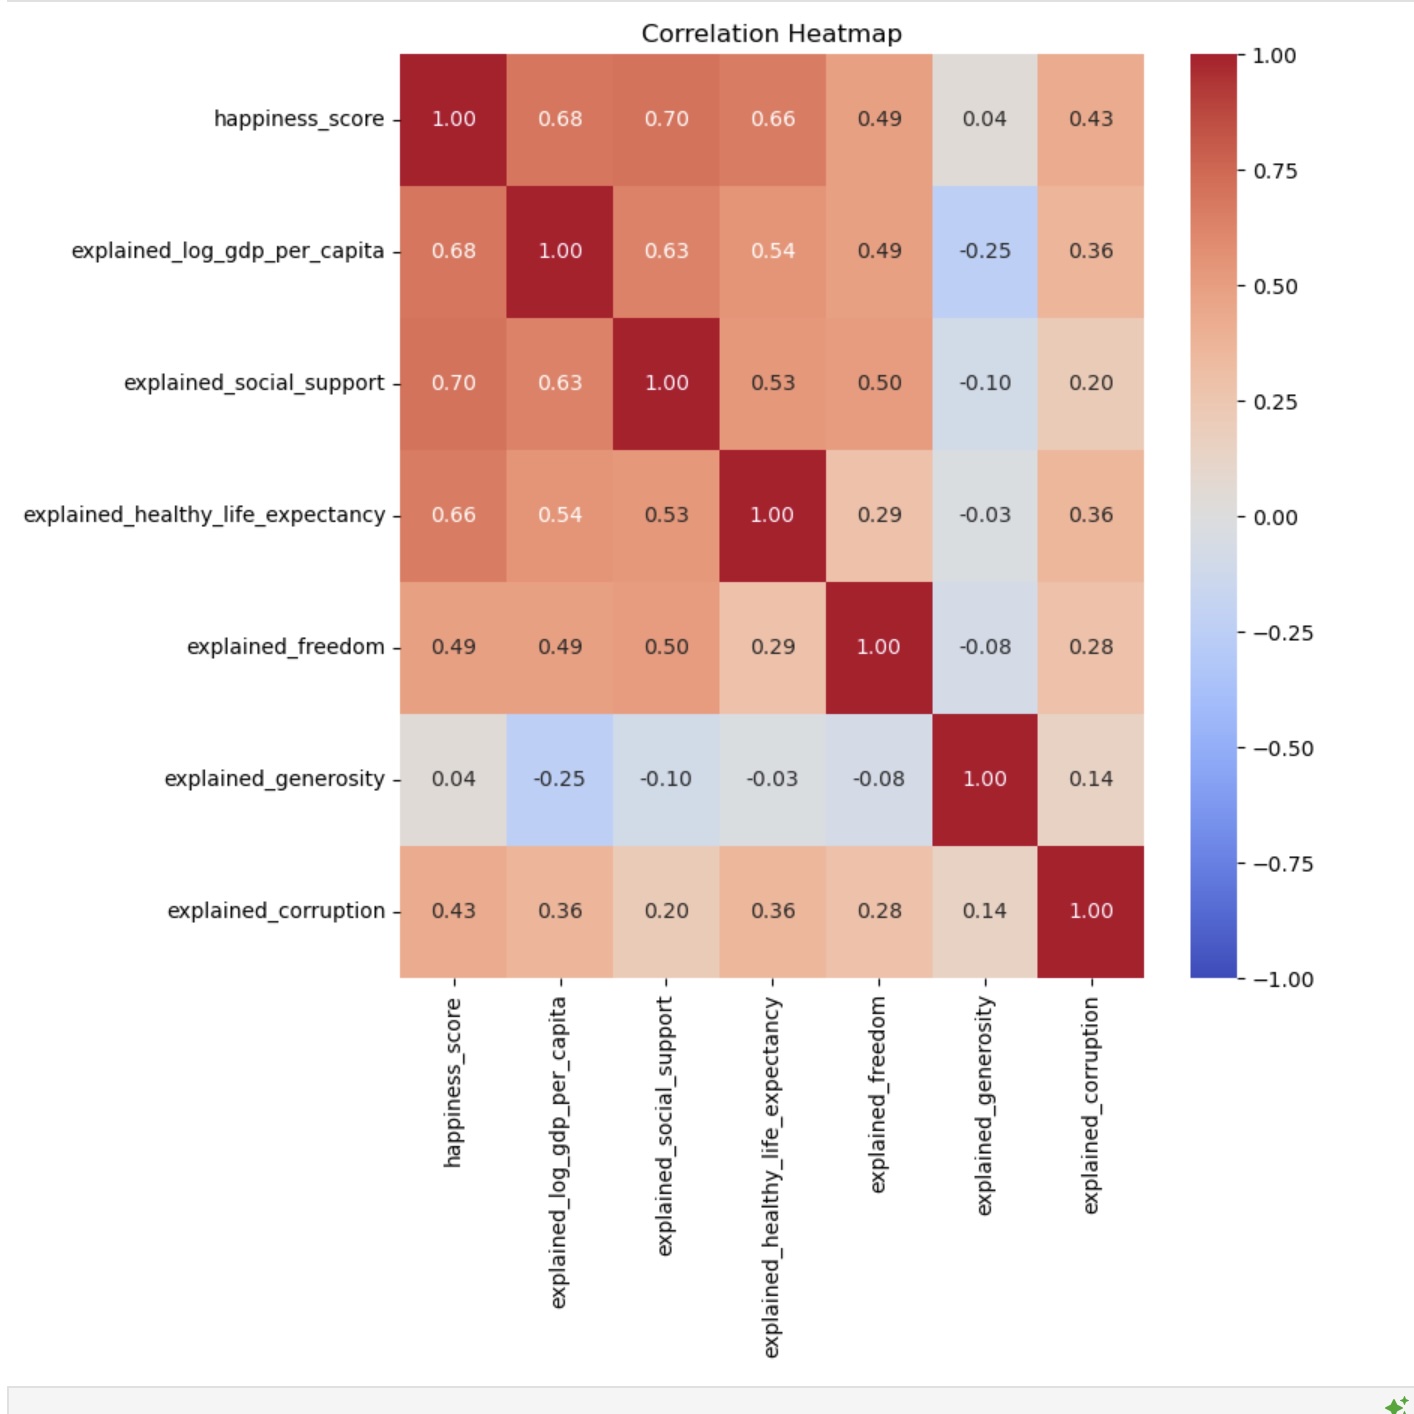
The correlation heat map shows that 3 of the variables stand out when it comes to affecting one's happiness. As the correlation between happiness and log gdp per capita, social support and healthy life expectancy are 0.68, 0.70 and 0.66 respectively. Whereas, generosity did not affect happiness much. As it only has a correlation value of 0.04 with happiness, along with having low correlation variables with the other variables.
Overall, some key takeaways from this analysis are:
Firstly, as shown on the correlation heatmap, there are 3 key drivers in determining the average happiness of a country: log gdp per capita, social support & healthy life expectancy, where countries could focus on improving these aspects to improve the overall happiness of the country.
Secondly, in theory generosity and wealth should have a relatively strong positive correlation but in this dataset it has a weak negative correlation which may go against typical beliefs that people with more wealth are more generous. Additionally, this could be why generosity also has a small impact on happiness as countries with higher gdp per capita could primarily be using money to buy things they want.
These findings could be used to inform policy decisions for countries with lower happiness scores. Specifically, policies aimed at improving the country's gdp per capita, healthcare system and welfare. Specific ones could be infrastructure development, this improves productivity and creates jobs. Potentially, also increasing access to healthcare for more rural areas.